Back in February, I gave a talk to the UCLA Digital Labor Working Group about my network analysis with the Labor Who’s Who data. You can see my slides here.
I opened with the idea that “the labor movement” is an abstraction–a place-holder phrase that means different things at different times. The American Labor Who’s Who was a particular version of that abstraction, created at a particularly contentious moment in labor history. It was compiled by a team led by Solon De Leon (son of a famous radical polemicist), and published by the Socialist Party aligned Rand School of Social Science. It describes a labor movement that encompasses not only trade unions, but also radical political movements, immigrant organizations, researchers, journalists, and what we would call “NGOs” today. My analysis, drawn from data extracted from the Who’s Who, is an abstraction of an abstraction.
It’s worth beginning with this caveat because computation and data visualization have an aura of legitimacy these days. These network charts (created in Gephi) are representations of reality, not reality itself. They are best used as models of plausible past realities, tools for thinking through problems of historical argument, rather than as illustrations per se.
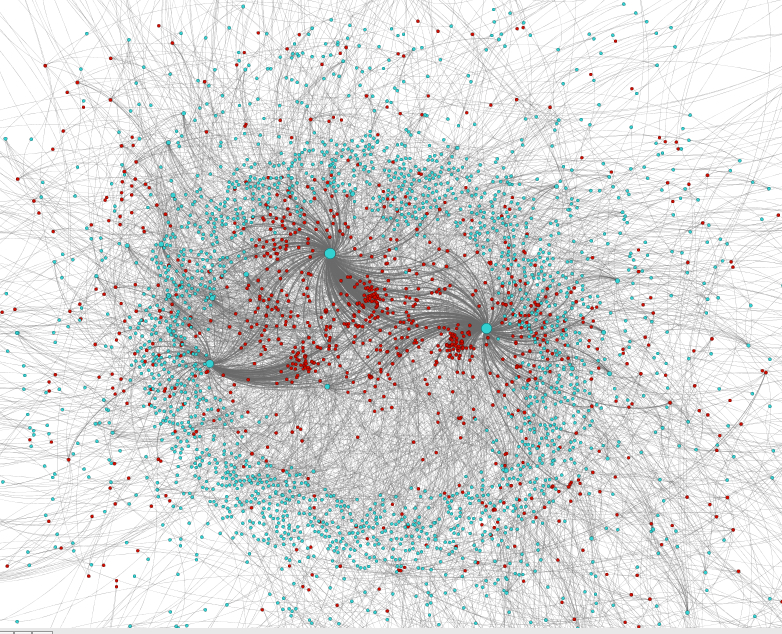
I began with the broadest and busiest view of the data: all the people in the Who’s Who and organizations they belonged to (slide 1). The mathematical model that creates this chart draws more connected elements, or “nodes,” closer to the center and pushes less connected elements to the edges. A node’s size depends on how connected it is to other nodes, and lines connect people to the organizations they belong to. In these charts, the lines, or edges, have direction. People belong to organizations, so radiate from each person to their corresponding organizations.
In broad strokes, the first graph presents a ring of organizations roughly the same size, three organizations that are noticeably larger on the inside edge of the ring, and several groupings of people inside the ring. Without knowing the names of the people or the organizations, it appears that three or four organizations dominate the institutional field of the labor movement. There is also a lot of “noise.”
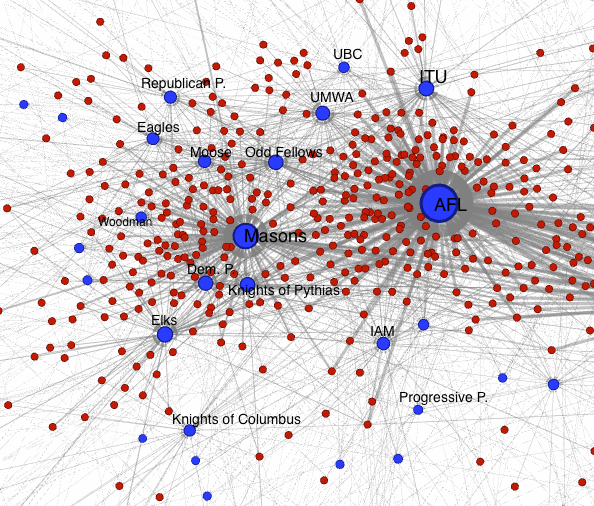
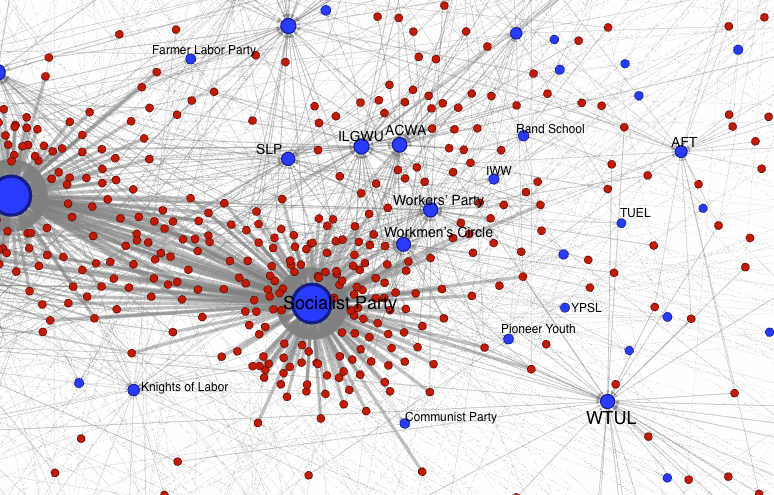
The next two slides try to filter out some of that noise by focusing on the “right” and “left” flanks of this social formation (think of it as “stage right”). The American Federation of Labor (AFL) and the Masons dominate the right side of the field (slide 2), surrounded by other fraternal organizations (Elks, Odd Fellows, Moose, etc.), mainstream political parties, and four trade unions–the Printers (ITU), Machinists (IAM), Miners (UMWA), and Carpenters (UBC). On the left (slide 3), the Socialist Party dominates, and is surrounded by independent unions (two garment worker unions and the IWW), left-wing parties and para-party organizations (Communist and Workers parties, the Trade Union Educational League, left-wing youth organizations, and the Workmen’s Circle. Worth noting: the spatial position of a node has no relationship to its place on the left/right political spectrum. The Women’s Trade Union League and the American Federation of Teachers, for instance, are farther away from the SP than the Workers’ Party, for instance. (In future I should probably reorient these vertically!)
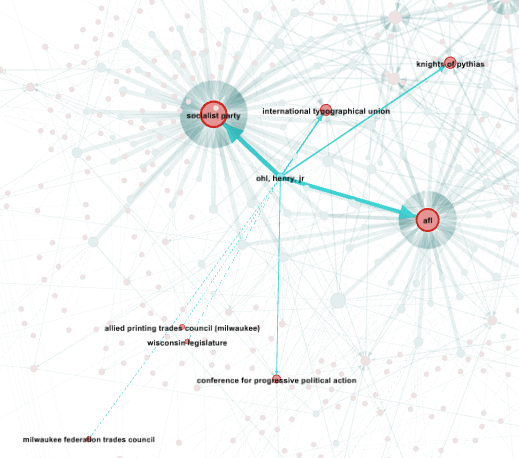
Next come two slides that focus on two individuals who show up near the center of the graph, and represent mediating figures between the AFL and SP-oriented flanks of the movement. Henry Ohl, Jr. (slide 4) was a Milwaukee Socialist and a printer who championed the University of Wisconsin’s School for Workers.
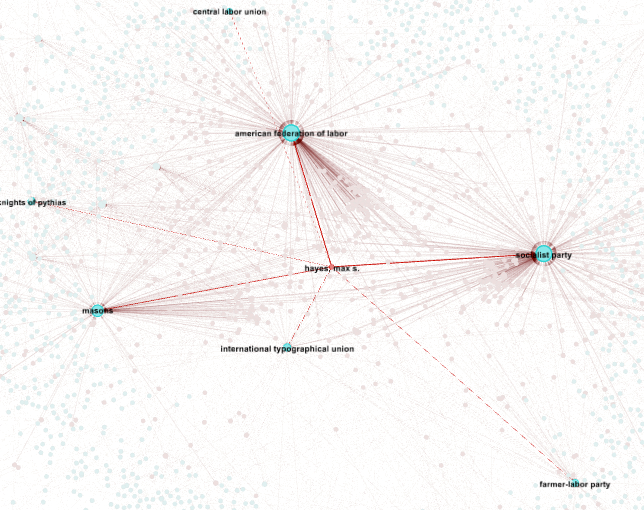
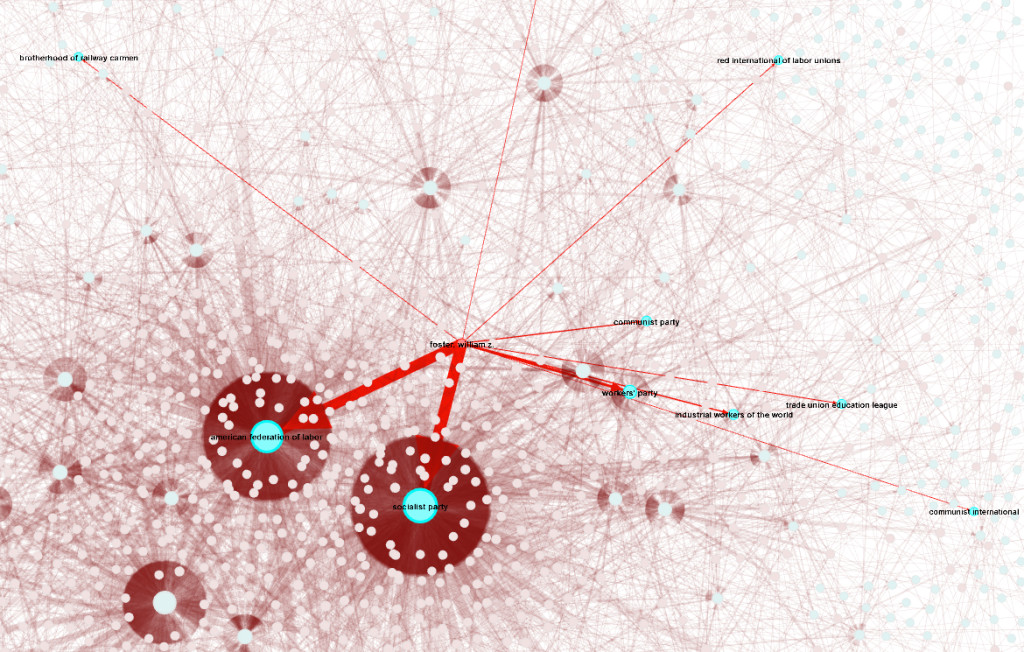
Max Hayes (slide 5) was a Cleveland Socialist–another printer–and the editor of the Cleveland Citizen. Both men started working in their early teens, apprenticed as printers, and were deeply involved in Socialist politics. Compare these two men with William Z. Foster (slide 6). He also linked the AFL and the SP, but by 1925 was publicly associated with the Workers’ Party and is placed farther on the periphery of the graph. Similarly, women union activists sit on the periphery of these network graphs, as do a number of labor intellectuals.
Whether Foster (or Pauline Newman or A. Philip Randolph) was less “central” to the labor movement of 1925 than Ohl or Hayes is not really what the graph explains. Centrality in this model is not the same as “importance.” Ohl and Hayes are more “central” because they were members of fraternal associations, and their membership creates a relationship in this model that draws them closer to the many non-Socialist men who were likewise part of the world of the Masons, Odd Fellows, Elks, and Moose.
Unfortunately, we can’t see how this chart would change by 1940 when new leaders and organizations were in the field, and some of those on the periphery in 1925 moved to the center (e.g., Sidney Hillman). But the lack of chronology also helps us see the way careers in the labor movement spanned multiple institutions (e.g., Max Hayes in the Peoples Party and the SP).
Labor and radical history is often told one organization at a time, one city at a time, one campaign at a time. Of course we use the singular focus as a way to get at broader themes. When I researched my first book, I began with IWW harvest workers, and that opened out onto a whole constellation of social forces, places, and people. Network graphs, for all their complications and limitations, turn our eyes first to the relatedness that structures a social field. The “labor movement” of the 1920s was a particularly contentious place where splits between one wing or the other severed ties between erstwhile comrades. But groups and individuals in contentious relationships are still in relationships. A labor movement divided and fighting was still a movement to overturn the worst abuses of capitalism.
An insight I’ve gained from my research on workers’ education in between the world wars is that organizational schisms were not always the end of the story. Quite often they produced more talk, more action, and more learning. “There is no one road to freedom,” said the author of a popular workers’ education pamphlet, “There are roads to freedom.”
**************************
Note: I know the charts mix up colors and orientations. Extracting good charts from Gephi is one of the big challenges of this project, and I’m working on some other–also imperfect–ways to share the visualizations in more active form.